
By Andy May
References to the images and data are given in this essay as hyperlinks. I’ve done my best to verify the accuracy of the content by checking multiple sources. When references had different dates for the same event, I chose the most commonly cited date or the most prestigious source. All dates (except some in the modern era) are given as “BP” or before the year 2000 for simplicity, using 1950 (the radiocarbon zero) was too cumbersome.
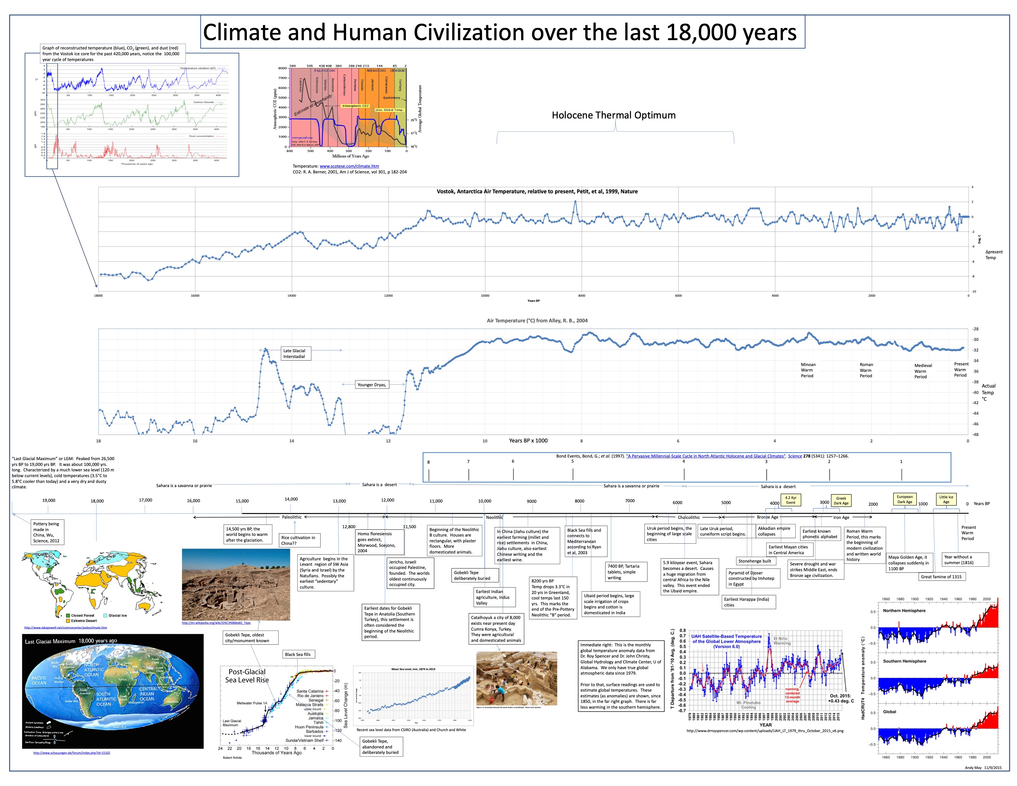
The heart of the poster is the timeline of historical and climatic events. The Last Glacial Maximum (LGM) ended around 19,000 BP, the illustrations on the lower left of the poster illustrate what the world was like then. Much of the land area of the world was under ice or desert at the time and the exposed land had less precipitation than we do today. The history of civilization shows that cooler periods have less precipitation than warmer times. It seems counter-intuitive, but warm air has a higher water carrying capacity and this leads to more rain. For example, the Sahara is now becoming greener as Carbon Dioxide and air temperature go up. If there were any organized human civilizations during the last glacial period we have not found any evidence of it, other than some pottery in China, dated to 20,000 BP. At this time people lived in small communities of a few families and hunted for animals and edible natural vegetation. Domesticated animals (with the exception of dogs) and sedentary agriculture would not appear for another 6,000 to 7,000 years, around 13,000 BP.
Dogs were probably domesticated by man by 14,000 BP and perhaps more than 30,000 BP. The Natufians collected wild grains, fruits and vegetables and probably cultivated small gardens as early as 14,000 BP. But, this early, large scale organized farming was unlikely.
The central part of the poster shows two ice core records. The top chart is the most recent portion of the Vostok Antarctic ice core record. The entire Vostok 400,000 year record is shown in the upper left of the poster with the time scale reversed, this chart also includes the Carbon Dioxide concentration (in green) and the dust concentration (in red). The roughly 100,000 year Milankovitch cycles are very apparent in the Vostok record. These cycles are composed of a dominant period of 413,000 years and lesser periods that fall between 95,000 years and 136,000 years. The tilt of the Earth’s axis is what produces our seasons and it varies about 3° on a 41,000 year cycle. Finally, the Earth’s axis wobbles (the precession cycle) on a cycle that should be 25,772 years. Due to modifications in the precession cycle predominantly by the Moon, Jupiter and Saturn, the dominant precession period is roughly 19,000 years with a secondary peak periodicity of around 23,000 years. The 25,772 year cycle is in theory only.
[…]
Conclusions
Correlation is not causation, but many, if not all, of man’s worst times since the last glacial maximum occur during colder and dryer periods. Often these times were made worse by warfare as in the Greek Dark Ages, the sacking of Rome, the collapse of the Akkadian Empire, etc. The colder and more arid climate could have been part of the cause of the wars. We go to war when we are starving and thirsty. More importantly, I was unable to find evidence of a crisis that was due to warming.
Given that man-made Carbon Dioxide is a very recent phenomenon, the radical climatic changes before 200 years ago cannot be attributed to man’s influence. They must be natural. The recent warming of 0.85°C from 1880 to 2012 is pretty small compared to other temperature changes in the Holocene. It is clear from history that natural forces can cause significant climate changes. It is also clear that droughts are usually associated with colder periods, not warmer periods. Some climate changes are probably due to variations in the Earth’s orbit, but some might be due to variations in TSI (total solar irradiance) or other solar influences. How much is due to nature and how much is due to man is unknown.
Much of the last 18,000 years is characterized by more rapid sea-level rise than we see today. The current rise of sea level is very slow relative to the past and we are arguably more adaptable due to modern technology.
Read the full article at Watts Up With That?

Merely an aside — but furthermore, as for the estimated 0.85°C increase from 1880 to 2012, since the presumed margin of error is 0.4°C, the estimated increase is statistically indistinguishable from a 0°C increase.
For reference, see James Corbett’s “Lies, Damned Lies, and Global Warming Statistics,” URl: https://www.corbettreport.com/lies-damned-lies-and-global-warming-statistics/ , time reference: @ 15 minutes 24 seconds. Of course, the entire video is very much worth the viewing and listen.
Thanks for the post,
-N
Very interesting indeed. Thanks for the link 🙂
Hi Keld,
You may (or may not) find this particular post interesting: “Global Warming: How It All Began — by Richard Courtney” / URL: http://www.john-daly.com/history.htm
To quote a comment I left elsewhere and to save myself a bit of time since its already written:
I still have to dig a bit more to find other independent corroborating sources (I don’t yet know how much ‘faith’ I can reasonably place in anything that Richard Courtney might have to say on the matter, I’ve only just come across this person’s scribblings), but on the basis of this piece, if one were to take it at face value or at least at first blush, it would seem that the ‘alarm’ was first sounded by ‘western conservatives,’ under the leadership of Margret Thatcher and with the support of her UK political party. At the time, the promotion of nuclear power was high on the agenda of the establishment from a military-industrial standpoint, and conjoining this particular ‘interest’ with that of the environmentalists [then] seemed by the political elites a very pragmatic effort to pursue, more likely than not to succeed . . .
–N
Just another teaser for you, from Courtney’s essay, this flowchart illustrating the feedback effects of mutually re-enforcing ‘interests’ invested in promoting the idea of anthorpogenically induced global warming:
Courtney titles his chart: “Positive feedbacks supporting UK imagined risk of global warming.”
(Again, I’m pilfering my own comments from elsewhere. Hope you don’t mind)
That was a brilliant background analysis. And a real good read. Shanks very much for sharing 🙂